
Smart money leaves footprints. See where they lead.
Directional Fractals finds a small pattern on your chart, boxes it in gold, and draws that same pattern again beside price, only bigger. One look shows you the direction it projects.
Get accessOn your chart in three steps
- 01
Add it
Open TradingView and the chart you trade. Click Indicators, go to Invite-only scripts, and click Directional Fractals.
- 02
Read it
A gold box marks the fractal. Next to price, the indicator draws the projection: the same pattern, only bigger.
- 03
Follow it
Every turn has a number. As price moves, the same numbers appear on your candles, so you always know where you are in the pattern.
Three things on the chart.
Nothing else.
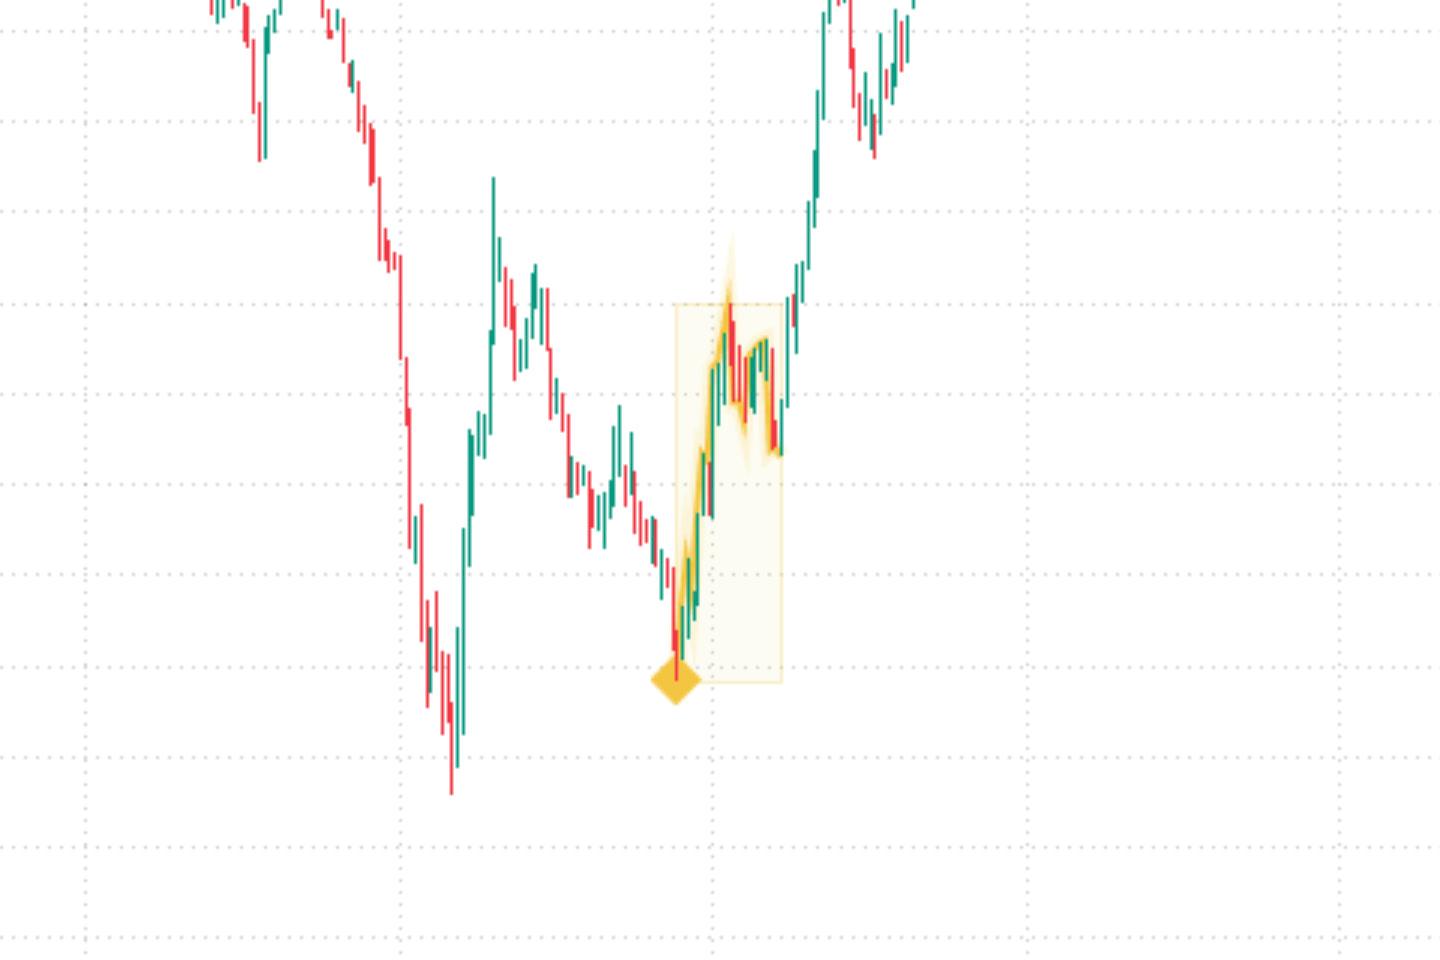
A gold box
The small pattern the indicator found for you, boxed in gold on your candles.
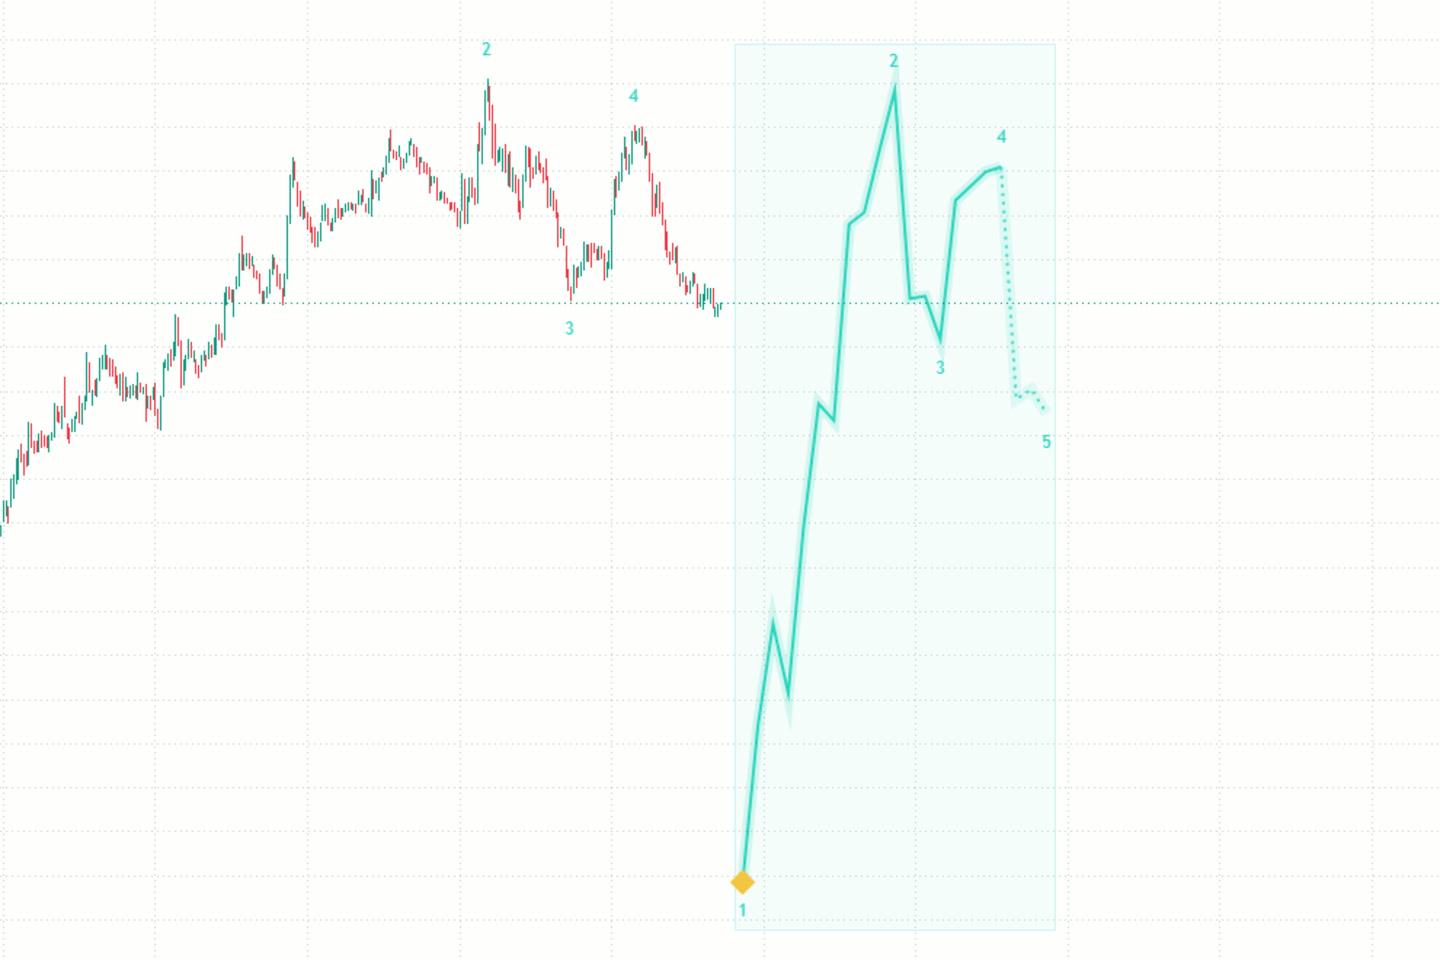
The same pattern, bigger
Drawn beside price, so it never covers your candles. Green means bullish. Pink means bearish.
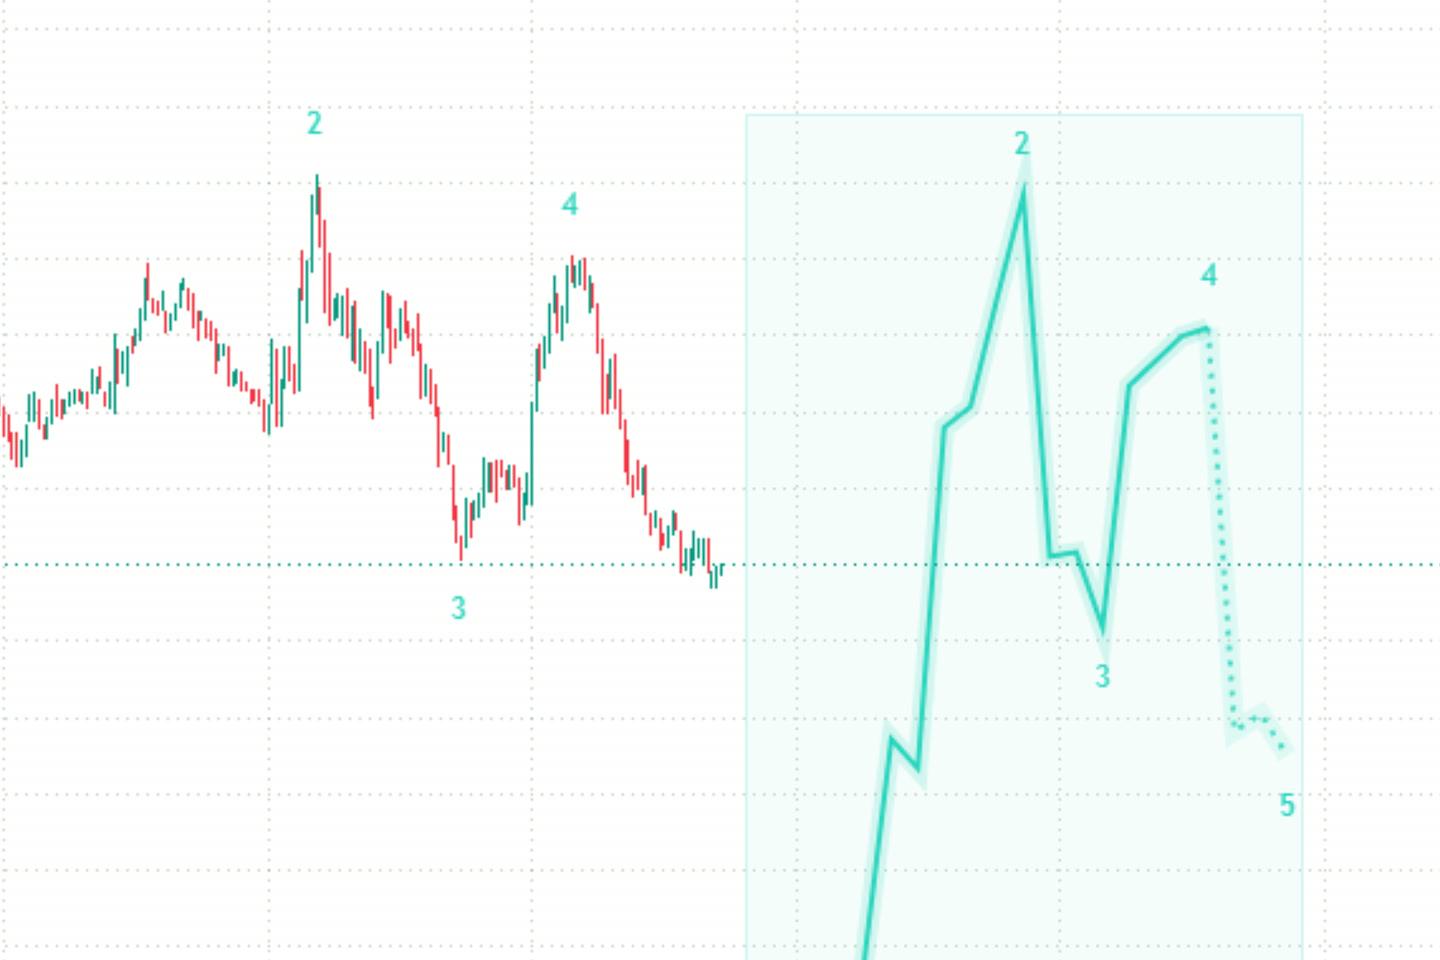
Know where you are
Each turn of the projection is numbered. As price reaches a turn, the same number appears on your candles.
Simple to read, simple to trust
Solid and dotted
The solid line is the part price has already done. The dotted line is what is still ahead.
It tells you when it's over
If price breaks the pattern, the projection disappears. You always know when the idea is over.
One projection per fractal
Once a projection is drawn, new candles do not redraw it. It stays as it is until the pattern ends.
Nothing to tune
One on/off switch and three colours. No inputs to optimise.
Look at what came after
the small fractal.
The projection is the small fractal drawn again at a larger size. When price finishes the same shape at that larger size, we look at what followed the small fractal and treat the same move as the next part to watch for.
That is a scenario read from the chart, not a promise of where price will go. What you do with it, including position size and risk, is your decision.
Pick your plan
Every plan includes the indicator and access to the Fractal Trading Floor on Discord for the term you buy. Longer terms cost less per month.
One month of access.
Three months of access.
Six months of access.
Analytical tool for chart study — not financial advice. Trading involves substantial risk.